Analytical Electronics Services Pvt Ltd

Budgetary Source of Test & Measuring Equipment

Authorized Distributor

AES, India - Authorized Distributor of Pico Technology    AES, India - Authorized Distributor of DranetzBMI    AES, India - Authorized Distributor of Pintech
Buy Sell Rent Repair

PicoScope Oscilloscope Software - Spectrum Analyzer Software

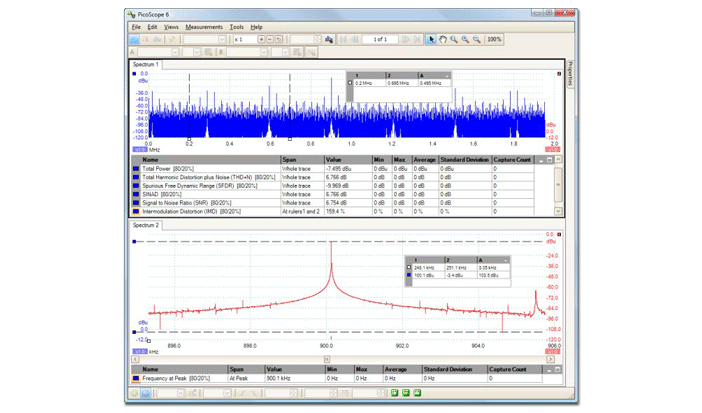
The spectrum analyzer plots amplitude against frequency. In other words it shows signals in the frequency domain (as opposed to the oscilloscope which shows signals in the time domain – amplitude against time). It is especially useful for tracking down the cause of noise or distortion in measured signals. As an example, a peak at 50 or 60 Hz would suggest noise due to mains pick-up. Higher-frequency peaks may be easily identified as switching noise from power supplies or noise from digital circuits. Average mode is provided to reduce the effects of random noise and Peak Hold mode is useful for testing amplifier bandwidths.

The frequency spectrum is divided into a number of ‘bins’. The more bins, the higher the frequency resolution. The maximum number of frequency bins is determined by the number of samples taken. Using a PicoScope 5000 Series Oscilloscope it is possible to have up to 1,048,576 bins and produce a very high-resolution spectrum display.

The PicoScope FFT spectrum analyzer includes window functions (Blackman, Gaussian, triangular, Hamming, Hann, Blackman-Harris, flat-top and rectangular) to reduce unwanted artefacts that are created during the sampling process.

Spectrum Analyzer Software


Related Links

PicoScope 6 Software  |  PC Oscilloscope


(All trademarks acknowledged) E. & O. E.


Ask for PicoScope detailed specification.


Feel free to contact us for any queries you may have.